
2026 Distribution Strategy for Fintech and Web3: The End of Fake Growth
Fintech and Web3 distribution is moving away from cheap surface metrics toward proof of user quality. In 2026, the stronger teams will measure channels by verified users, funded accounts, active wallets, repeat transactions, fee generation, and retention.
At Green Dots Research, we keep coming back to one distribution question: When a fintech or Web3 product spends one dollar on growth, what quality of user comes back?
For years, distribution was treated as a channel mix problem. Teams tested paid ads, KOLs, PR, quests, airdrops, referral loops, Discord campaigns, community pushes, and almost every other growth mechanic you can name.
The problem is that many teams measured the easiest numbers to inflate: impressions, clicks, installs, wallet connects – or quest completions.
By 2026, that logic is wearing out.
It is whether that activity turns into users who trust the product, activate, retain, and generate revenue.
This matters even more for financial apps.
A fintech product asks users to connect identity, move money, hold balances, trade assets, take risk, or trust a protocol. A Web3 product often asks users to connect wallets, deposit funds, bridge assets, sign transactions, or interact with smart contracts.
So a cheap install or wallet connect means very little if the user never completes KYC, never deposits, never transacts, or disappears after receiving a reward.
My read: 2026 will be the year distribution gets less tolerant of fake demand.
The market is moving from volume to quality
Fintech and Web3 distribution is shifting from volume-based growth to quality-based growth.
The question is no longer only: How many users can this channel bring in?
The better question is: How many of those users verify, deposit, transact, retain, pay fees, refer others, or come back without being paid again?
Marketing budgets also leave less room for fake efficiency.
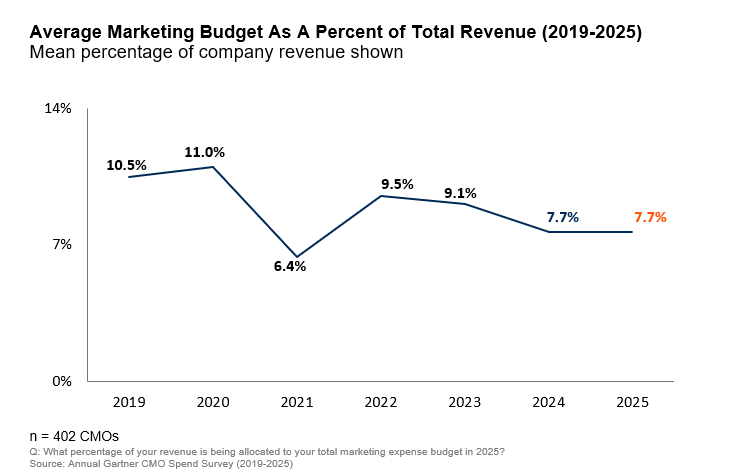
Gartner’s 2025 CMO Spend Survey found that marketing budgets stayed flat at 7.7% of company revenue, while 59% of CMOs said they did not have enough budget to execute their strategy. Paid media still took 30.6% of marketing budgets, but media inflation means teams are getting less for every dollar spent.
At the same time, digital advertising keeps expanding.
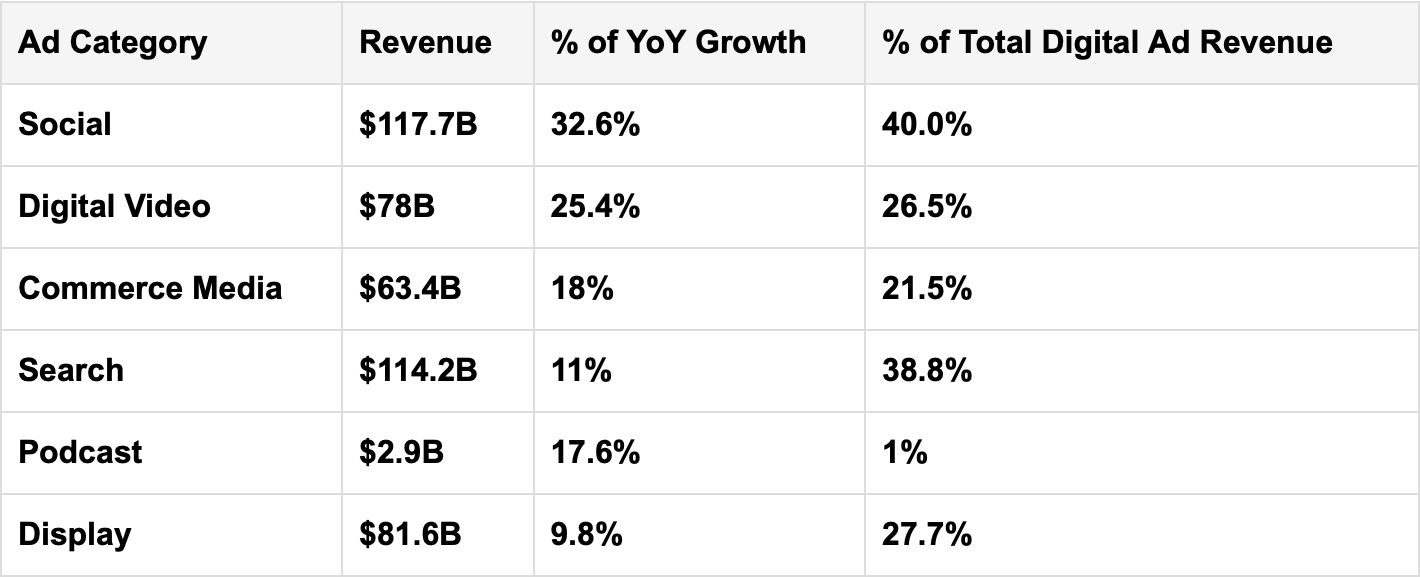
IAB and PwC reported that U.S. digital ad revenue reached $294.6B in 2025, up 13.9% year over year. Social reached $117.7B, search reached $114.2B, display reached $81.6B, digital video reached $78B, and programmatic advertising reached $162.4B.
So the market is crowded from both sides.
More money is flowing into digital channels, but teams have less room to waste budget on low-quality users.
That is why the core 2026 distribution question is simple: How many acquired users stay, transact, deposit, pay fees, refer others, or come back without being paid again?
Paid ads are still the base layer
Paid media is still the most controllable way to scale distribution. It lets teams test messages, capture demand, and push traffic into measurable funnels.
But in fintech and Web3, paid acquisition has to be evaluated much deeper than CPC, CPI, or CPL.
Search, for example, is still valuable because it captures explicit intent.
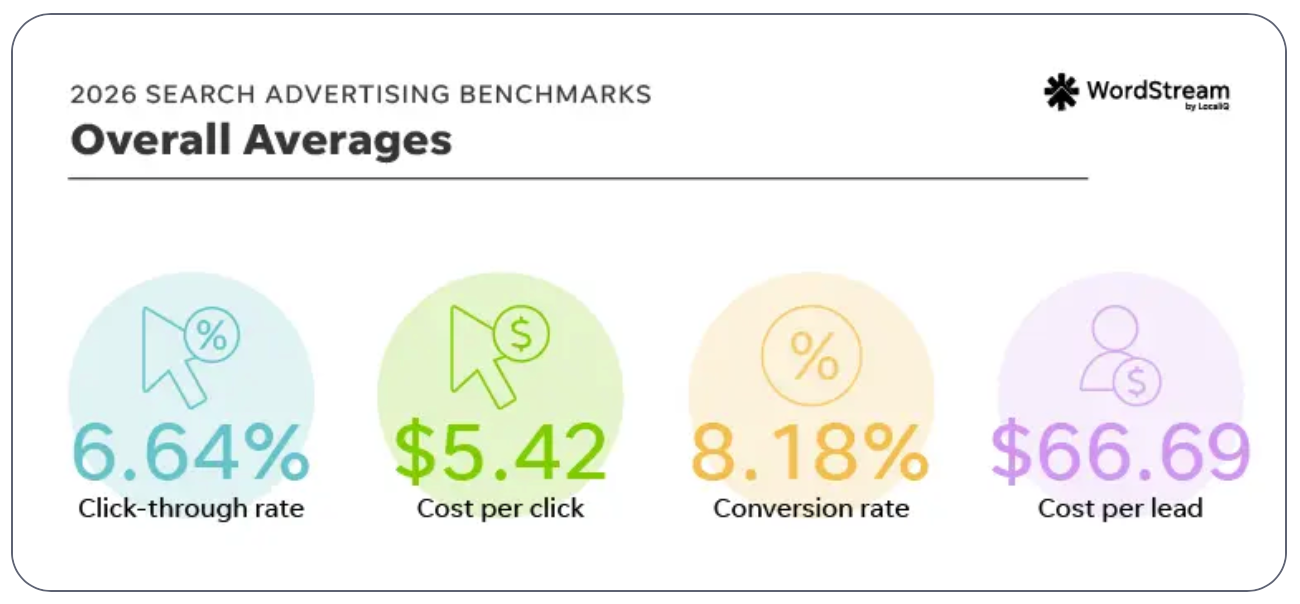
WordStream’s 2026 Google Ads benchmark, based on more than 13,000 campaigns from April 2025 to March 2026, reported an average search CPC of $5.42 and an average CPL of $66.69. In Finance & Insurance, average CPC was $3.39 and average CPL was $74.44.
Useful numbers, but only the beginning.
For fintech, the real paid acquisition metrics are KYC completion, first deposit, first transaction, funded account, retained balance, revenue per user, fraud rate, and payback period.
That is even more important considering that finance app data shows that the category is still growing, but competition is getting more sophisticated. Adjust reported that:
- Finance app sessions rose 16% year over year in H1 2025
- LATAM finance app installs rose 59%
- Global finance app CPI decreased from $1.51 to $1.13
- Banking apps had the highest day-one retention among finance subverticals at 20.6%.
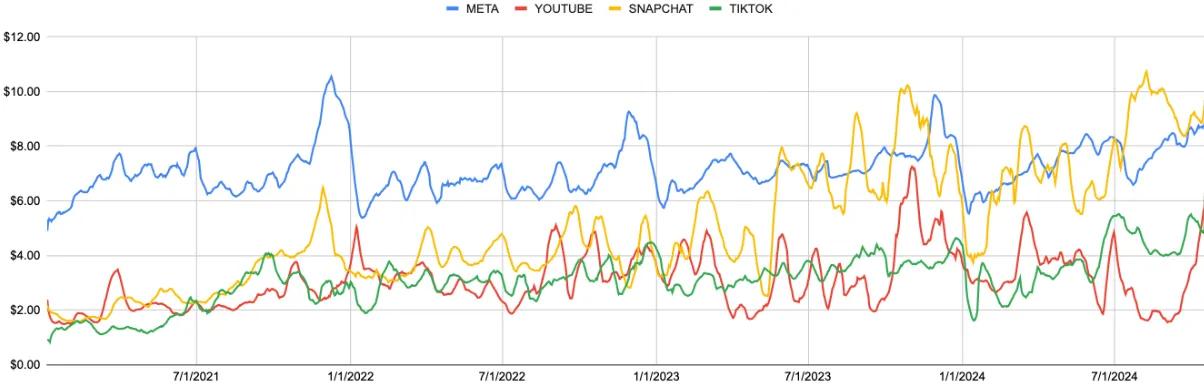
Paid social plays a different role. It is usually stronger for education, retargeting, message testing, and creator amplification than for high-intent conversion.
Gupta Media’s 2025 social CPM tracker reported average CPMs of $8.19 for Meta, $4.82 for TikTok, $4.99 for YouTube, $8.60 for Snapchat, and $4.67 for Pinterest. Do the rest of the funnel math yourselves.
PR becomes trust distribution
PR is often treated as a launch channel. For financial products, I think it is better understood as trust distribution.
Journalists are still open to useful PR, but the bar is higher. Cision’s 2025 State of the Media report found that 86% of journalists immediately reject pitches that do not align with their beat or audience. At the same time, 72% still cite press releases as the most useful PR resource, and 85% say the best way to start a relationship is a simple introductory email.
For fintech and Web3, the strongest PR assets are substance-led:
- proprietary data;
- security practices;
- regulatory clarity;
- proof of reserves;
- risk frameworks;
- market maps;
- founder commentary.
Generic launch announcements have weak distribution power unless they carry a real market signal.
However, PR will rarely be the cheapest acquisition channel. Its value sits across the whole funnel. A credible article can improve search visibility, investor confidence, partner conversion, landing page trust, creator narratives, and founder authority. This is why I expect more financial companies to invest in research-led PR in 2026.
Influencer marketing becomes an operating layer
Creator marketing is becoming a serious budget line.
CreatorIQ reported that:
- Average annual influencer marketing budgets grew 171% year over year
- 71% of organizations increased investment
- Nearly two-thirds of the new spend came from traditional paid and digital channels
IAB also reported that creator advertising reached $37B in 2025 and projected it to reach $44B in 2026.
For fintech and Web3, this makes sense. Financial products need repeated explanation. Users need to understand the use case, the risk, the mechanics, and the reason to trust the product. Good creators can often explain these things better than brand channels.
But this channel has a very clear failure mode.
A creator with reach can still bring low-quality users, compliance risk, or pure attention with no activation. This is especially true in crypto, where audiences are used to sponsored posts, token incentives, and short-term narratives.
The stronger creator strategy in 2026 will be more selective.
I would expect better results from expert micro-creators, niche analysts, founder collaborations, product explainers, long-term ambassador programs, and creator content that can be reused in paid ads.
The key metric should move from reach to retained action.
- For fintech, that may mean funded accounts, deposits, card usage, transfers, or subscription revenue.
- For Web3, it may mean swaps, deposits, staking, borrowing, governance participation, fee generation, or repeat wallet activity.
Display still has a role – but not as cheap noise
Display is easy to dismiss, but the category remains large.
IAB and PwC reported that display advertising reached $81.6B in 2025, up 9.8% year over year. Programmatic advertising reached $162.4B, up 20.5%.
The issue is quality.
ANA’s Q3 2025 Programmatic Transparency Benchmark reported that web and mobile headline CPM was $4.27, while TrueCPM was $6.66. That gap matters because cheap inventory can hide waste once quality, viewability, and supply-chain efficiency are considered.
ANA also reported in Q2 2025 that $26.8B in global media value is still lost each year to programmatic inefficiencies.
For fintech and Web3, broad cheap display is usually weak as a direct-response channel. It can still work in specific roles: retargeting, trusted finance publisher placements, newsletter sponsorships, native ads, B2B account-based marketing, and contextual placements around market events.
Higher-quality context is the display bet for 2026.
And you can get more high-quality research like this.
Just subscribe, it's free.
Web3 enters the post-quest era
Web3 has one distribution advantage most fintech products do not have: public behavioral data.
A wallet can show what a user actually does. That made quests, points, airdrops, allowlists, and wallet-based campaigns powerful growth tools.
But the market has also learned the weakness of this model. Many protocols acquired users who never retained, never generated revenue, and only inflated metrics while waiting for an airdrop. The original logic was close to “fake it till you make it”: create visible activity, show traction, attract capital, and hope real usage follows.
When everyone does this, the system starts to break. Farmers simulate demand, teams report inflated growth, token rewards get sold, and the next protocol has to pay more for lower-quality activity.
We do not yet have a clean public time series proving that quest-platform spend is down across the whole market. But the 2025-2026 evidence explains why protocols are becoming more skeptical of quests as a primary acquisition engine.
DappRadar found that projects have distributed more than $20B through airdrops since 2017, while 88% of airdropped tokens lose value within three months. It also found that activity often falls back toward baseline within weeks, with many users cashing out after claiming.
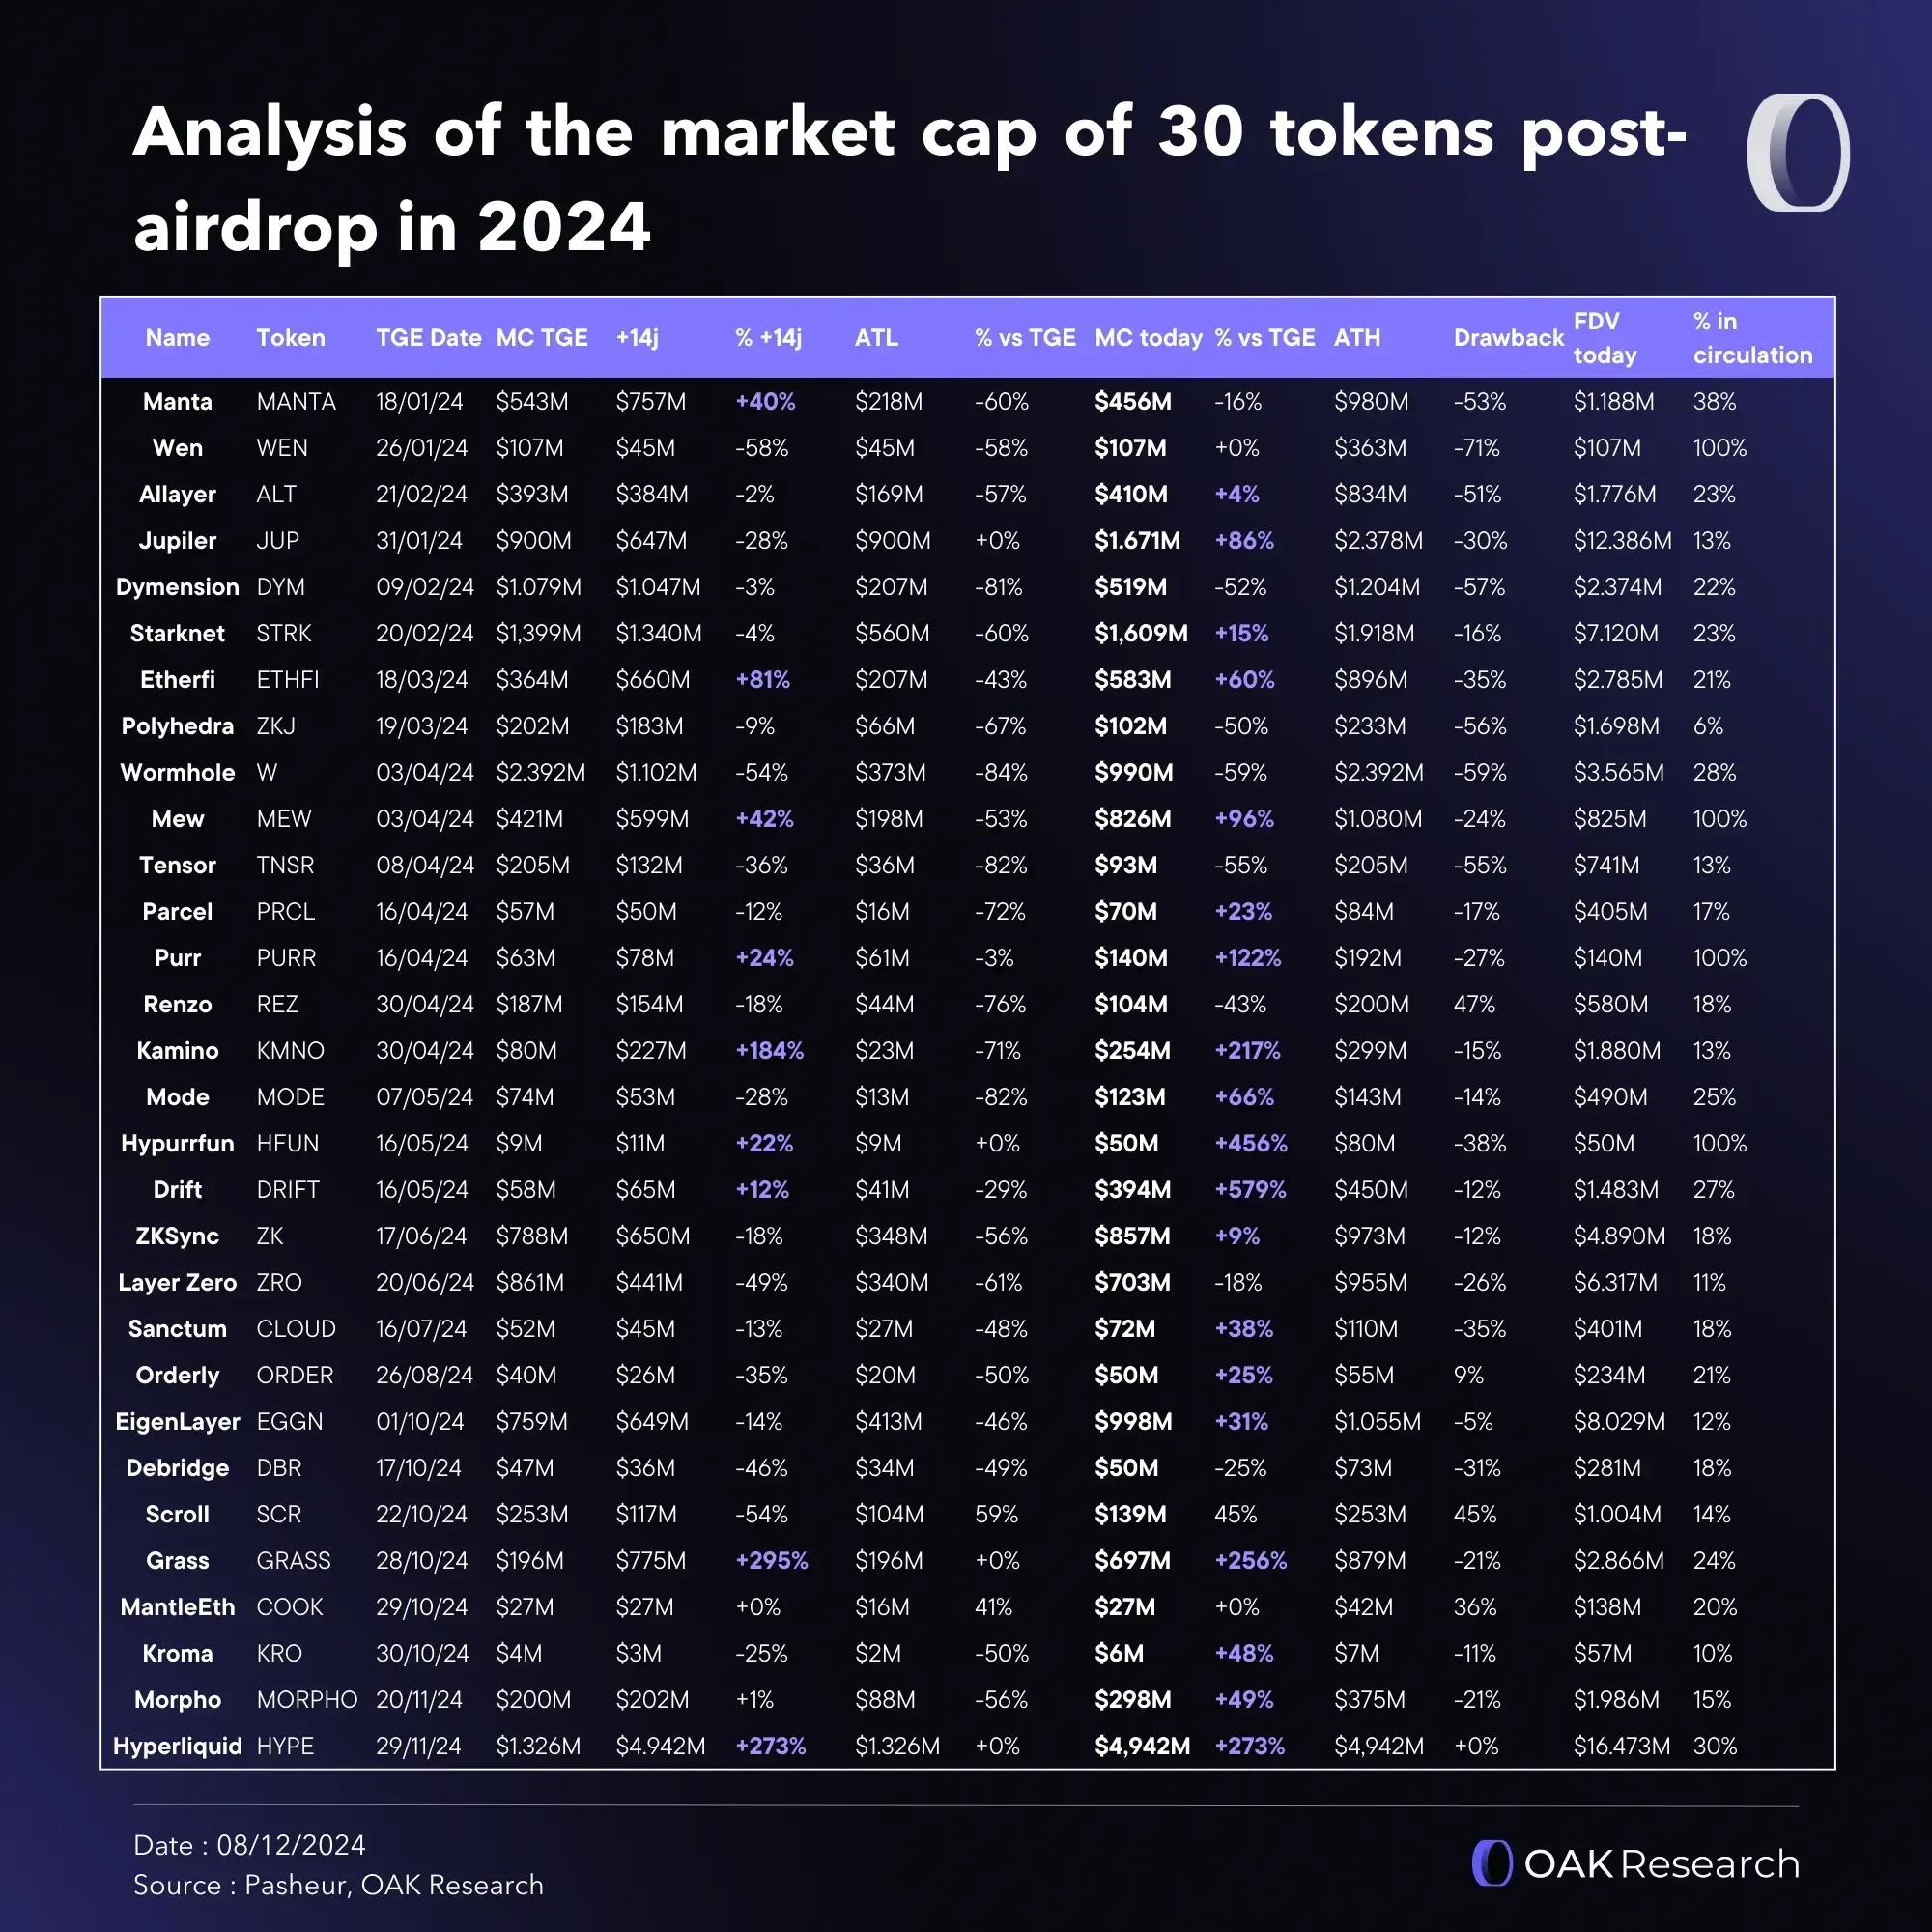
Decrypt’s review of the five biggest 2025 airdrops shows a cooler market compared with 2024. The top five 2025 airdrops peaked at $4.5B, while 2024 airdrops granted users more than $19B at all-time-high prices. Several major 2025 airdrop tokens then declined sharply from their peaks.
A separate 2025 paper on Sybil detection analyzed 193,701 addresses, including 23,240 Sybil addresses, which shows how large the fake-user problem has become.
The stronger version asks users to prove fit through meaningful actions: deposits, swaps, holding periods, governance, fee generation, referrals, wallet history, and retention.
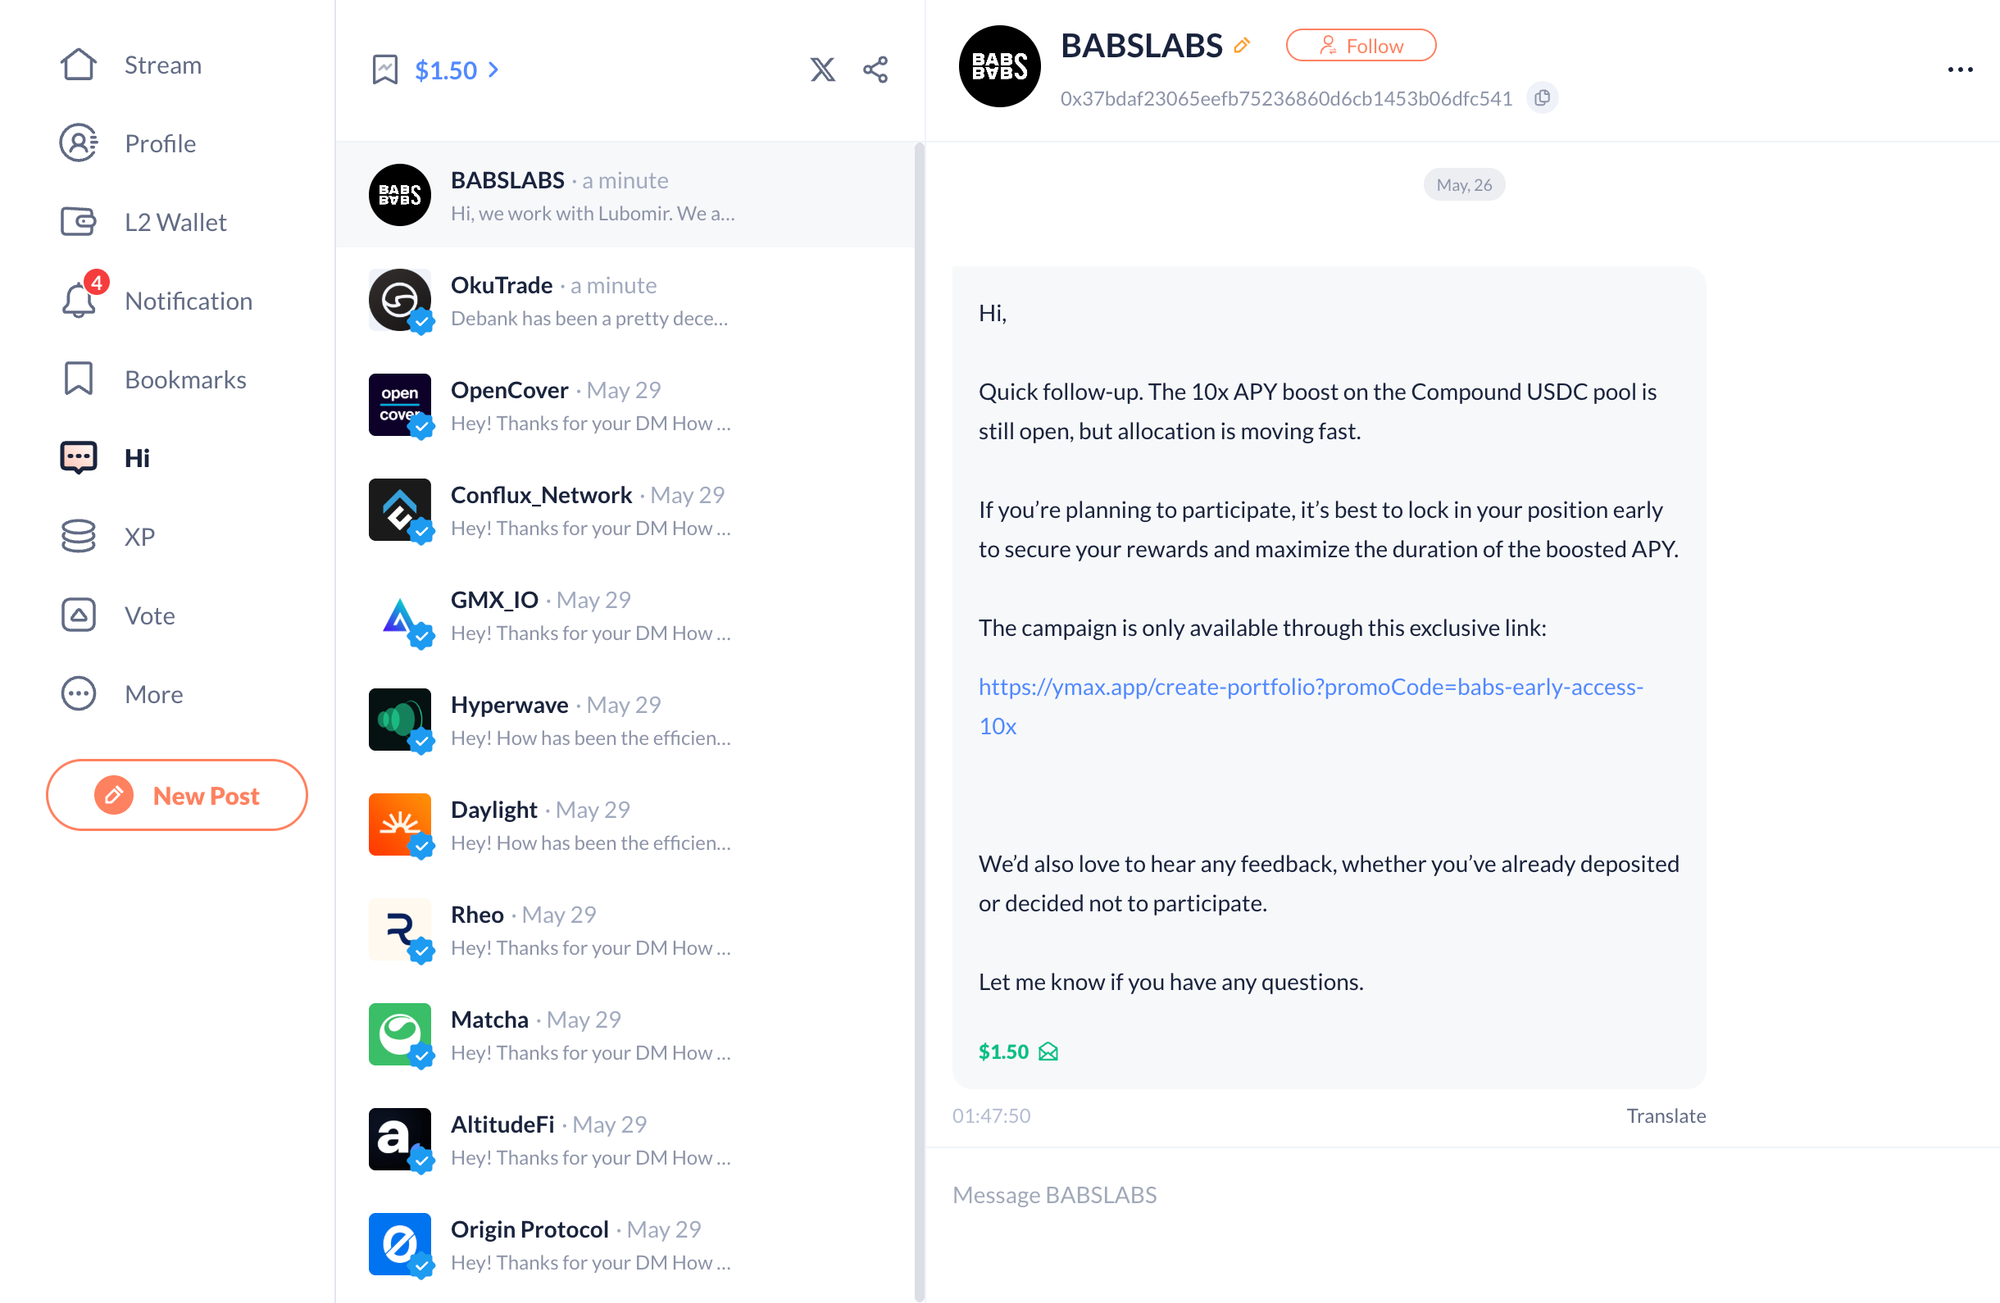
The same logic applies to DeBank-style targeting, wallet-based outreach, and cold DMs. Mass messaging is reputationally risky and usually low quality.
Narrow, wallet-aware outreach can be useful when the user’s onchain behavior already shows clear product relevance. But it's still very experimental. Public 2025–2026 conversion benchmarks for this tactic are still weak, so I would treat it as some guerilla marketing tactics.
What teams should measure in 2026
The old growth dashboard rewarded surface activity. The 2026 dashboard needs to reward user quality.
For fintech, the useful metrics are:
- verified users;
- KYC completion;
- first deposit;
- funded account;
- first transaction;
- repeat transactions;
- retained balance;
- revenue per user;
- fraud rate;
- payback period;
- referral quality.
For Web3, the useful metrics are:
- active wallets;
- real liquidity;
- repeat usage;
- fee generation;
- deposits;
- swaps;
- staking;
- borrowing;
- wallet history;
- retention after incentives decline.
This does not mean every channel should be judged by last-click revenue. PR, creator marketing, search, paid social, display, and wallet-based campaigns do different jobs.
But every channel should connect to a quality signal somewhere in the funnel.
A distribution system that cannot tell the difference between a retained user and a paid tourist is a reporting problem waiting to become a budget problem.
The distribution stack we expect to win
The strongest fintech and Web3 teams will build a stack.
- PR creates authority.
- Founders turn that authority into narrative
- Creators translate the narrative into education
- Paid social tests and scales the message
- Search captures intent
- Display and native ads support retargeting
- Wallet-based campaigns qualify users
- Lifecycle marketing turns acquisition into activation and retention.
That is the shift we care about most at Green Dots.
Distribution is becoming less tolerant of fake demand.
The teams that win in 2026 will be the ones that stop counting activity as growth before the market forces them to.
If you need help in designing your distribution strategy, don't hesitate to get in touch
Author note
Written by Stacy Muur, founder of Green Dots. Green Dots works with Web3 teams on GTM strategy, creator-led distribution, founder growth, and launch architecture.