
From 750+ Applications to 15 Long-Term Creators: A Green Dots Select Case Study
Green Dots Select turned 750+ creator applications into 15 validated long-term partners. The $25K campaign produced 190 deliverables and 967K views on X while testing creators for research depth, consistency, narrative fit, and audience response.
How a $25K stealth creator campaign generated 967K views on X, produced 190 content deliverables, and helped a leading blockchain ecosystem test creators before committing to long-term paid partnerships.
Campaign results at a glance
| Metric | Result |
|---|---|
| Total creator applications | 750+ |
| Creators advanced to detailed evaluation | 118 |
| Final creator shortlist | 69 |
| Creators who joined the challenge | 49 |
| Eligible active participants | 40 |
| Winners selected for paid collaboration | 15 |
| Challenge content | 142 organic posts |
| Challenge views on X | 743,528 |
| Paid collaboration deliverables | 48 |
| Paid collaboration views on X | 223,725 |
| Combined content output | 190 deliverables |
| Combined views on X | 967,253 |
| Total client budget | $25,000 |
| Blended cost per view | $0.026 |
| Blended CPM | $25.85 |
A quick note on the numbers: throughout this case study, “views” means the total post views reported by X. It is not the same as unique reach, because one person may have viewed several campaign posts.
Creator selection is getting more expensive
Creator marketing is taking a larger share of brand budgets.
IAB expects US creator ad spend to reach $44 billion in 2026, up from $13.9 billion in 2021 and $29.5 billion in 2024. Nearly half of creator-media buyers now describe creators as a “must buy”, but brands still report that finding the right creators is their biggest challenge.
CreatorIQ’s 2025–2026 research points in the same direction. Average reported creator-marketing budgets increased by 171% year over year, and 71% of surveyed organisations said they had increased investment. The study covered 1,723 marketers, agencies and creators across nine regions.
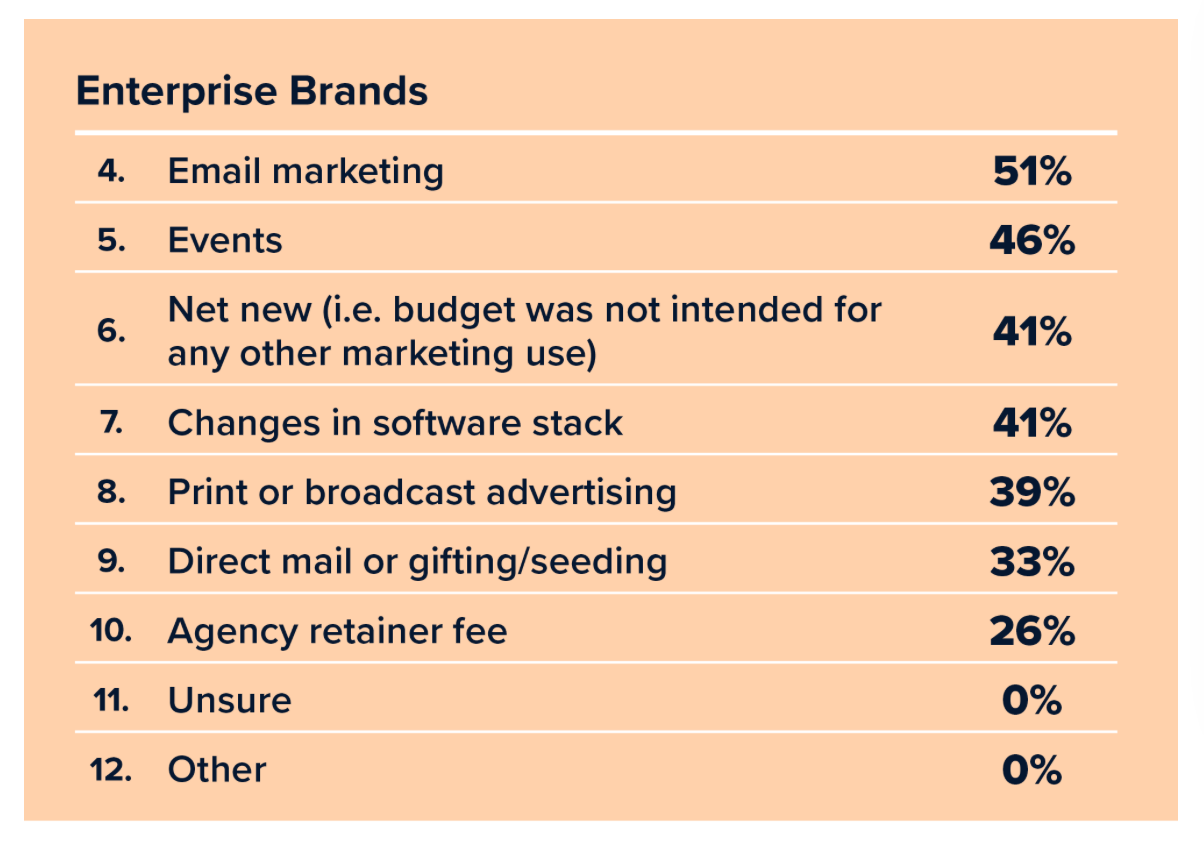
The simple market read: as budgets grow, a poor creator decision becomes more expensive.
Follower count, historical engagement and old campaign screenshots can help with initial screening. They still do not tell a brand how someone will perform for a specific product, narrative or ecosystem.
The questions that matter are more practical:
- Will the creator research the product properly?
- Can they add an original market perspective instead of repeating the brief?
- Will they stay active after the first post?
- Can they react to new announcements and changing narratives?
- Does their content attract relevant discussion, or mostly low-signal engagement?
- Are they someone the brand can work with for months, not just one campaign?
Green Dots Select was designed to answer those questions before the client committed a long-term creator budget.
What is Green Dots Select?
Green Dots Select adds a validation stage between creator discovery and long-term collaboration.
Instead of choosing a recurring paid cohort from media kits and profile data alone, Green Dots runs a structured research challenge. Creators have to show how they understand the brand, interpret its ecosystem and communicate it in a live campaign environment.
The process has three stages:
| Stage | Purpose |
|---|---|
| Discovery | Identify creators with relevant audiences, content expertise and initial profile fit |
| Validation | Evaluate creators through original content, consistency, research depth, narrative contribution and engagement |
| Long-term collaboration | Onboard the strongest performers into a structured paid creator programme |
The challenge does two jobs at the same time.
First, it generates research, educational content and market discussion while the selection is still happening. Second, it gives the brand direct evidence of how each creator works before longer-term budgets are allocated.
That is the main difference: creator selection stops being a private spreadsheet exercise and becomes part of the campaign itself.
Want to get more research and case studies like this directly into your inbox?
Don't hesitate to subscribe. It's absolutely free.
The campaign setup
The client was one of the leading blockchain ecosystems in Web3. Its identity remains confidential.
The first Green Dots Select campaign ran in stealth mode.
Neither the client nor Green Dots announced the competition publicly. Creators were identified, screened and invited privately, so participation depended on direct interest in the opportunity and the possibility of qualifying for a longer-term paid relationship.
The programme had two connected phases:
| Phase | Duration | Objective |
|---|---|---|
| Creator validation challenge | 3 weeks | Test creator quality, consistency, narrative fit and audience response |
| Paid winner collaboration | 1 month | Continue working with the 15 strongest creators through a planned content calendar |
The total client budget across both phases was $25,000.
Building the creator funnel
The process started with more than 750 creator applications. Every application was reviewed manually.
The first screening looked at:
- historical content quality;
- relevance to crypto, DeFi and on-chain audiences;
- research and educational capabilities;
- audience fit;
- recent posting activity;
- general profile and brand suitability.
After this review, 118 creators were advanced to a more detailed evaluation.
The second stage looked more closely at recent performance, research depth, content consistency and topic expertise. Moni and Sorsa data were used as supporting creator-intelligence signals, not as automatic selection rules.
That process produced a final shortlist of 69 creators.
Green Dots Select creator funnel
| Stage | Creators | Stage conversion |
|---|---|---|
| Applications received | 750+ | – |
| Advanced to detailed evaluation | 118 | Up to 15.7% of applicants |
| Passed secondary review | 69 | 58.5% |
| Joined the challenge | 49 | 71.0% |
| Met the participation requirements | 40 | 81.6% |
| Selected as winners | 15 | 37.5% of eligible creators |
Fewer than 2% of the original applicants eventually became Select winners and entered the paid collaboration.
The conversion from shortlist to active participation was especially strong:
| Invitation outcome | Creators | Share of shortlisted creators |
|---|---|---|
| Joined the challenge | 49 | 71% |
| Declined | 16 | 23% |
| Remained undecided and did not join | 4 | 6% |
| Total shortlisted | 69 | 100% |
A 71% acceptance rate is notable because there was no public launch or competition hype. The private invitation, the client profile and the possibility of a paid long-term relationship were enough to activate most of the shortlist.
Who participated?
The final cohort included 49 English-language crypto creators on X.
Pre-campaign creator pool
| Metric | Result |
|---|---|
| Total participants | 49 |
| Primary platform | X – 100% |
| Primary market | English-speaking global audience – 100% |
| Average audience size | Approximately 25,600 followers |
| Average Sorsa Score | 369 |
| Average Moni Score | 1,578 |
| Average Moni Level | Level 3 – Developing |
Most participants specialised in one or more of these formats:
- data-led market analysis;
- educational threads;
- long-form research posts;
- ecosystem and product explainers;
- DeFi and on-chain research;
- news commentary;
- market opinions;
- concise summaries;
- crypto-native viral formats.
The programme did not treat large audience size as the main signal. The average account had approximately 25,600 followers, so much of the pool sat in the micro- and mid-sized creator range.
What mattered more was whether a creator could explain a complex product, contribute a useful perspective and reach the right Web3 audience.
How the challenge worked
For three weeks, participants produced original research, analysis and educational content about the ecosystem.
Green Dots shared weekly guidance based on:
- client announcements;
- product updates;
- ecosystem developments;
- market narratives;
- features that needed more education;
- topical content opportunities.
The directions were optional. Creators kept control over:
- the topic they selected;
- the thesis of the post;
- their interpretation;
- the format;
- the writing style;
- the connection to their existing content and audience.
This balance was deliberate. The client could point creators toward strategic priorities without turning the campaign into 49 versions of the same promotional post.
Broader creator-economy research supports that approach.
Deloitte found that high-ROI brands were 40% more likely to place the greatest importance on a creator’s creative vision, including autonomy and efficient approval processes.
What the client controlled
| Area | Client and Green Dots role |
|---|---|
| Strategic priorities | Identified the products, updates and narratives requiring attention |
| Factual accuracy | Supplied source material and confirmed relevant product facts |
| Campaign schedule | Defined the challenge timeline and reporting cadence |
| Evaluation | Reviewed cumulative creator performance |
| Amplification | Selected strong content for additional distribution |
What creators controlled
| Area | Creator role |
|---|---|
| Content thesis | Developed their own interpretation or argument |
| Format | Chose between long-form posts, threads, explainers and other native formats |
| Voice | Maintained their established tone and writing style |
| Topic selection | Chose from optional directions or identified relevant angles independently |
| Audience framing | Adapted the subject to the interests and knowledge level of their followers |
A two-layer creator structure
Green Dots ran a separate amplification plan alongside the challenge. Selected creators retweeted or quote-tweeted some of the strongest participant content. This separated two functions that are often bundled into one KOL deal: creating the research and distributing it.
| Creator layer | Primary function |
|---|---|
| Research and content layer | Produce original analysis, education and narrative-building content |
| Amplification layer | Increase distribution through retweets, quote tweets and reach-focused formats |
Research creators were judged mainly on the value of their content. Strong posts could then receive extra distribution from creators better suited to amplification.
Challenge performance
Across the three-week challenge, participants published 142 organic posts and generated 743,528 views on X.
Weekly performance
| Quality parameter | Week 1 | Week 2 | Week 3 |
|---|---|---|---|
| Depth | 4.2 | 4.1 | 4.0 |
| Originality | 4.3 | 4.0 | 4.3 |
| Narrative contribution | 4.2 | 4.3 | 4.5 |
| Engagement quality | 4.2 | 4.3 | 4.4 |
Participation
| Metric | Result |
|---|---|
| Total participants | 49 |
| Eligible active participants | 40 |
| Ineligible participants | 9 |
| Eligible participation rate | 81.6% |
| Average posts per eligible participant | 3.55 |
| Average views per challenge post | 5,236 |
Activity stayed fairly stable in the first two weeks, then accelerated before the challenge ended.
Week 3 produced:
- 68% more posts than Week 2;
- 35% more views than Week 2;
- the highest average narrative-contribution score;
- the highest average engagement-quality score.
But more content did not translate into proportionally more views.
Views per post
| Week | Posts | Views | Average views per post |
|---|---|---|---|
| Week 1 | 40 | 289,186 | 7,230 |
| Week 2 | 38 | 193,210 | 5,084 |
| Week 3 | 64 | 261,132 | 4,080 |
This is why output volume was not the main winner-selection metric. A creator who posted more often did not automatically deliver stronger reach efficiency, deeper research or more narrative value.
How creators were evaluated
Each submission was scored across four qualitative dimensions.
| Criterion | What Green Dots evaluated |
|---|---|
| Depth of thinking | Whether the creator moved beyond a basic product description and demonstrated meaningful research |
| Originality | Whether the content introduced a distinct argument, example, framework or interpretation |
| Narrative contribution | Whether the post helped expand or clarify a strategically relevant ecosystem narrative |
| Engagement quality | Whether the content generated informed responses from relevant participants rather than low-signal reactions |
Green Dots reviewed cumulative performance across the full challenge. One viral post was not enough to win.
The final assessment considered:
- qualitative content scores;
- consistency across several weeks;
- total output;
- views and distribution;
- engagement quality;
- responsiveness;
- overall contribution to the campaign.
This gave the client a more realistic view of how each creator might perform in an ongoing relationship.
Selecting the 15 winners
Green Dots and the client selected 15 winners from the 40 eligible participants.
Winner performance
| Metric | Result |
|---|---|
| Winners selected | 15 |
| Original content pieces | 55 |
| Average posts per winner | 3.7 |
| Total views on X | 356,557 |
| Average views per winner | 23,770 |
| Average views per post | 6,483 |
| Average final score | 4.57 out of 5 |
The winners represented 37.5% of eligible creators, but generated:
- 38.7% of challenge content;
- 48.0% of challenge views.
Winners versus the remaining participants
| Group | Posts | Views | Average views per post |
|---|---|---|---|
| Selected winners | 55 | 356,557 | 6,483 |
| Other participants | 87 | 386,971 | 4,448 |
| Total | 142 | 743,528 | 5,236 |
The winners generated approximately 46% more views per post than the rest of the pool.
The interesting part is that the qualitative and distribution signals largely pointed in the same direction. Creators with stronger cumulative scores also produced above-average view efficiency as a group.
Still, the process left space for smaller research creators. Several winners had modest total views but scored highly for depth, originality or narrative contribution. A reach-only leaderboard would probably have filtered them out.
From challenge winners to paid creators
After the challenge, the 15 winners moved into a one-month paid collaboration.
Green Dots planned the publishing calendar in advance so content would be spread across the month instead of clustering around one announcement.
Each week, Green Dots aligned with the client on:
- upcoming announcements;
- product releases;
- ecosystem developments;
- priority narratives;
- educational gaps;
- relevant market events.
Creators then developed content around those directions in their own style.
One-month paid phase
| Metric | Result |
|---|---|
| Selected creators | 15 |
| Total deliverables | 48 |
| Total views on X | 223,725 |
| Average deliverables per creator | 3.2 |
| Average views per deliverable | 4,661 |
The goal of the paid phase was consistent visibility and narrative reinforcement.
The brand was now working with creators who had already:
- researched the ecosystem;
- demonstrated content quality;
- learned the relevant terminology;
- shown consistent participation;
- produced measurable audience response;
- established a working process with Green Dots and the client.
That removed much of the uncertainty that usually exists at the start of a long-term KOL relationship.
There may also be a commercial benefit to longer partnerships. Sprout Social reports that 71% of influencers offer lower rates for long-term or multi-post collaborations, while another 25% would consider doing so.
Combined campaign results
The validation challenge and paid collaboration produced 190 content outputs and 967,253 total views on X.
Full programme performance
| Phase | Content outputs | Views on X | Average views per output |
|---|---|---|---|
| Three-week validation challenge | 142 | 743,528 | 5,236 |
| One-month paid collaboration | 48 | 223,725 | 4,661 |
| Combined | 190 | 967,253 | 5,091 |
The challenge itself generated:
- approximately 75% of all content;
- approximately 77% of total views.
This changes the economics of creator discovery.
In a conventional process, screening is an internal cost. The brand pays for research, negotiation and evaluation before the public sees any campaign value.
With Select, the validation stage also produced:
- 142 original posts;
- 743,528 views;
- dozens of independent product interpretations;
- evidence of which narratives creators understood;
- performance data across 49 potential partners;
- a validated group for future activations.
Creator discovery became a distribution activity in its own right.
Campaign budget efficiency
The total client budget was $25,000.
Using the combined 967,253 views reported by X, the programme generated a blended cost per view of approximately $0.026.
The current benchmark CPV on X for fintech & Web3 products is $0.1 – so the Select design showed 4x better reach results.
Budget calculations
| Metric | Calculation | Result |
|---|---|---|
| Total client budget | – | $25,000 |
| Total views on X | 743,528 + 223,725 | 967,253 |
| Blended cost per view | $25,000 ÷ 967,253 | $0.0258 |
| Rounded cost per view | – | $0.026 |
| Cost per 1,000 views | $0.0258 × 1,000 | $25.85 |
| Blended cost per content output | $25,000 ÷ 190 | $131.58 |
| Programme spend per selected winner | $25,000 ÷ 15 | $1,666.67 |
I would be careful with a direct paid-media comparison here. The CPV is an all-in programme metric; it is not the same as a media CPM.
The $25K budget supported several outcomes at once:
- creator screening;
- live performance validation;
- organic challenge content;
- amplification;
- winner selection;
- one month of paid creator deliverables;
- development of a reusable long-term creator cohort.
The cost-per-winner figure also includes the content and views created across the programme, so it should not be treated as a pure creator-acquisition cost.
What the campaign demonstrated
1. Creator validation can generate campaign value
The client did not have to wait until selection was finished to receive content and distribution.
The challenge produced nearly three-quarters of all programme content and more than three-quarters of total views. Creator discovery became part of the campaign output rather than a separate preliminary expense.
2. Live performance data improved the long-term decision
Profile screening reduced 750+ applicants to 49 participants. The live challenge then revealed qualities that historical account data could not show clearly:
- ability to understand the ecosystem;
- response to content directions;
- consistency over several weeks;
- reliability;
- research effort;
- narrative fit;
- audience response.
The client entered the paid phase with observed performance data, not a forecast built mainly from follower count.
3. Follower count alone would have produced a different cohort
Several winners generated relatively low absolute views but received strong scores for originality, depth or narrative contribution.
Those creators can still be valuable for reaching the “smart” layer of Web3 audiences, even when their immediate distribution is smaller. The amplification layer gave strong research more reach without requiring every research creator to have a large account.
4. Cumulative evaluation reduced dependence on virality
Winners were assessed across three weeks and several dimensions. That stopped one unusually successful post from automatically outweighing:
- weak consistency;
- shallow research;
- poor responsiveness;
- limited narrative value;
- low-quality engagement.
The programme rewarded creators who could sustain quality across a longer collaboration.
5. Creative freedom supported stronger content
Participants received strategic context and source material, but they were not forced into a uniform script.
The result was a wider mix of:
- arguments;
- explanations;
- examples;
- market perspectives;
- formats;
- audience-specific interpretations.
This made it easier for the brand to identify creators whose natural communication style matched its long-term narrative.
6. The stealth format still produced strong participation
The campaign converted 71% of the final shortlist into active participants without public promotion.
This suggests that a clearly defined opportunity and credible long-term intent can attract relevant creators without relying entirely on a public competition or a large announcement.
7. The paid phase started with accumulated product knowledge
The 15 winners entered the paid collaboration after three weeks of research and content production.
The brand did not have to restart from basic onboarding or discover whether the creator could handle the subject. The creators already understood the ecosystem, its core narratives and the review process.
 Stacy Muur
Final thoughts
The first Green Dots Select campaign moved more than 750 applicants through a structured discovery and validation process.
49 creators joined the three-week challenge. 40 met the participation requirements. 15 moved into a one-month paid collaboration.
Across both phases, the programme produced:
- 190 content outputs;
- 967,253 views on X;
- a $0.026 blended cost per view;
- a validated group of 15 long-term creators.
The 15 winners generated 46% more views per post than the rest of the challenge pool and achieved an average qualitative score of 4.57 out of 5.
My main takeaway is not only the reach. The client finished the campaign with a research-led creator cohort whose members had already shown product understanding, consistency, originality and audience response.
For Web3 teams trying to build a sustained ecosystem narrative, that is a stronger starting point than selecting long-term partners mainly from follower counts, media kits and historical reach.
Subscribe to get new field notes when they go live.
Author note
Written by Stacy Muur, founder of Green Dots. Green Dots works with Web3 teams on GTM strategy, creator-led distribution, founder growth, and launch architecture.